Learn the concept
This is the step-by-step. For what it is and how it fits the bigger picture, read Reports in the reference.
This is the step-by-step. For what it is and how it fits the bigger picture, read Reports in the reference.
What this is
Reports turn your live data into figures you can read and share. Each part of Cloudby has its own Reports, so you run them close to the work they describe.
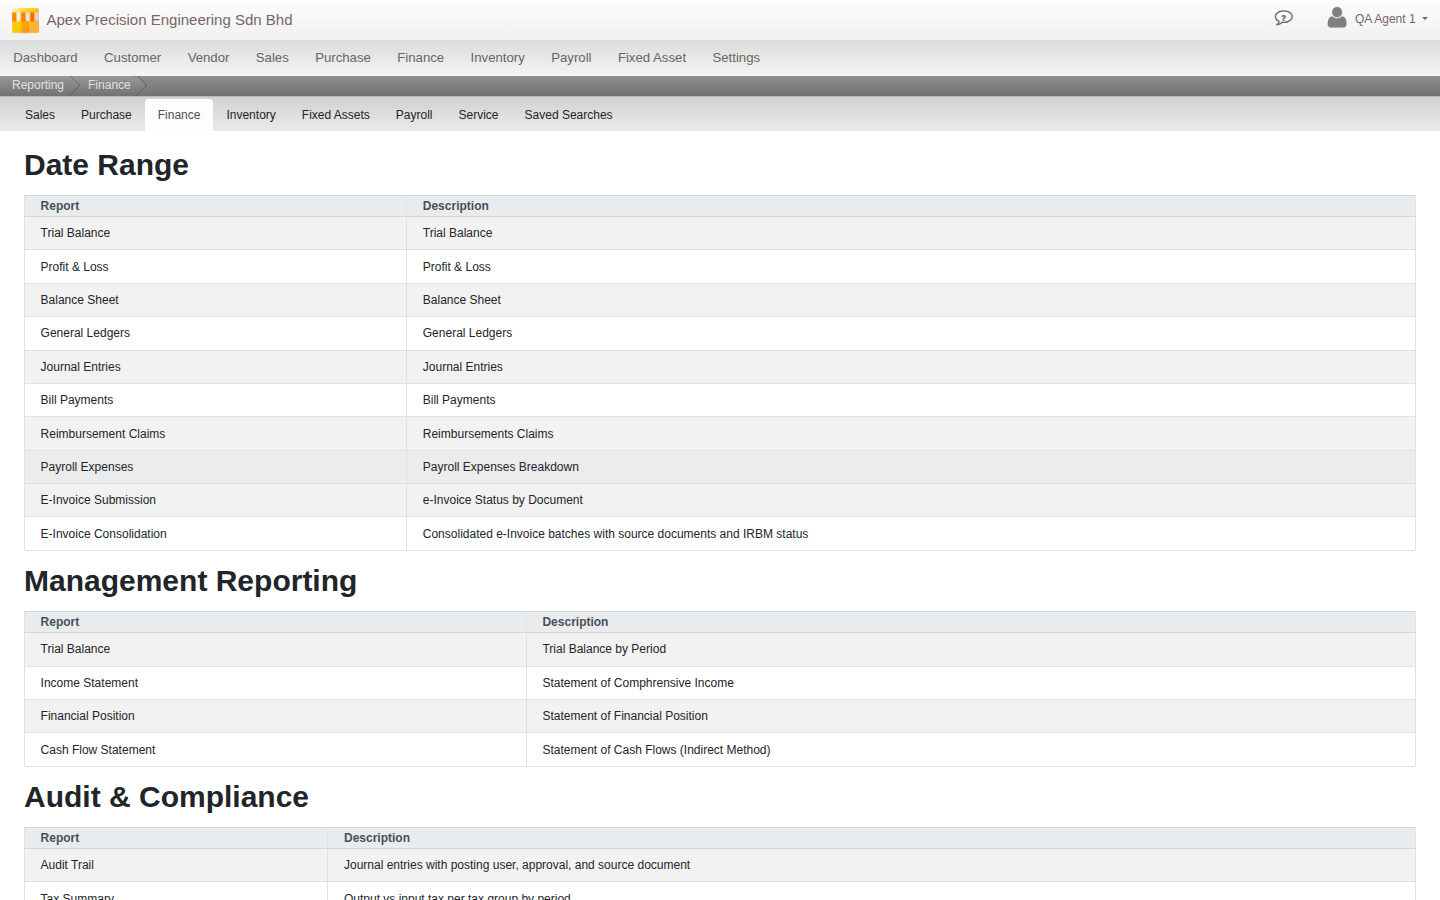
Where reports live
Look for a Reports item inside a module, for example Menu > Finance > Reports, Menu > Sales > Reports and Menu > Purchase > Reports. However you get there, you land on the same shared Reporting screen: a tab strip across the top lets you jump straight to any other module’s reports (Sales, Purchase, Finance, Inventory, Fixed Assets, Payroll, Service) plus your Saved Searches, without going back to the main menu.
How a report works
- Pick the report you want.
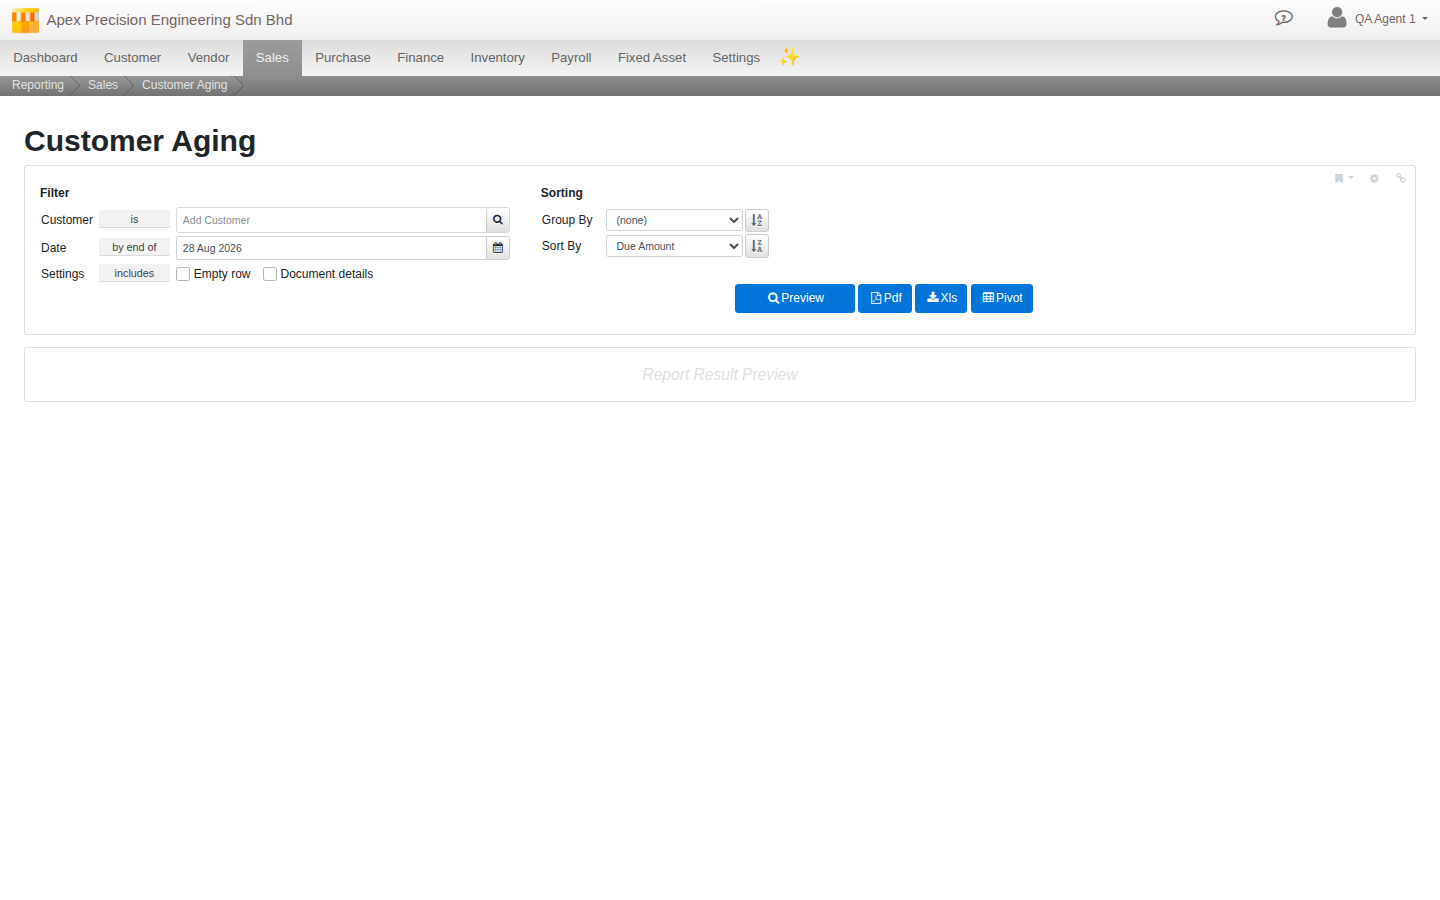
- Set the date range (on a date, or between two dates, with quick M / Q / Y / YTD period buttons) and any filters such as ledger, customer or product.
- Preview to read the result on screen, drilling into a line where you need the detail.
- Or export straight to PDF or Excel for sharing or further work, and some reports also offer a Pivot view.
Good to know. Reports read straight from your live records, so a report is always as current as the documents behind it. Posting a document updates the reports at once.